I am currently architecting a custom Kubernetes Monitoring & Autoscaling System to deepen my expertise in Cloud-Native engineering. My roadmap is ambitious tbvh, it moves from manual deployments to Terraform (IaC), and finally to a custom Autoscaler written in Go.
Working on this for last 2 days, I completed The Monitoring Base.
Instead of taking the easy route with a pre-packaged Helm chart, I deployed the entire stack manually using raw Kubernetes manifests. I wanted to understand exactly how Prometheus discovers targets, how RBAC permissions allow for metric scraping, and how stateful workloads persist data.
Here is a technical breakdown of the infrastructure I built.
1. The Workload: Novara Bookstore
Before monitoring, I needed something to monitor. I deployed "Novara," a full-stack bookstore application I built year back using React, TS, and PostgreSQL, you can read more about it here
Application Deployment Strategy
I defined the application in app.yaml using a Deployment resource.
-
Why a Deployment? It allows me to define a desired state (replicas) and handles the lifecycle of the pods (rolling updates, restarts).
-
Configuration: The app runs on port 5000. I used
secretKeyRefto inject theDATABASE_URLfrom a Kubernetes Secret, ensuring sensitive credentials aren't exposed in the repo. -
Networking: A ClusterIP Service sits in front of the pods, routing traffic from port 80 to the container's port 5000. This gives the internal network a consistent endpoint regardless of pod IP churn.
State Persistence (PostgreSQL)
Database management in Kubernetes requires careful handling of state. In postgres.yaml:
-
I used a PersistentVolumeClaim (PVC) requesting 1GB of storage, mounted at
/var/lib/postgresql/data. -
The Result: Even if the Postgres pod crashes or restarts, the volume remains intact, and no book data is lost.
Ingress
To expose the application to my local machine, I configured an NGINX Ingress Controller routing novara.local to the backend service. (Future plan is to Integrate Cloudflare Tunnel for secure public access).
2. The Monitoring Infrastructure
With the app running, I moved to the core of Phase 1: Prometheus. I created a dedicated monitoring namespace to keep these resources logically isolated.
Prometheus Architecture
The Prometheus server is defined in prometheus-deployment.yaml.
-
Configuration: I used a ConfigMap to mount the
prometheus.ymlconfiguration file. This decouples the config from the image, allowing me to update scrape intervals (set to 15s) without rebuilding the container. -
Storage: Just like the database, metric data needs persistence. I attached a PVC to the Prometheus deployment to ensure historical metrics survive pod restarts.
Solving the Discovery Problem (RBAC)
This was the most technical hurdle. Prometheus needs permission to "see" every Node, Pod, and Service in the cluster to scrape metrics. Default permissions don't allow this.
I implemented a comprehensive RBAC configuration:
-
ServiceAccount: Created a specific identity for the Prometheus pod.
-
ClusterRole: Defined cluster-wide permissions (
get,list,watch) for resources likenodes,endpoints, andpods. -
ClusterRoleBinding: The glue that binds the ServiceAccount to the ClusterRole.
Node Exporter (DaemonSet)
To monitor the underlying hardware (CPU, Memory, Disk), I deployed the Node Exporter.
-
Why a DaemonSet? Unlike a Deployment, a DaemonSet guarantees that exactly one copy of the pod runs on every node in the cluster. This ensures that as I scale the cluster, monitoring scales automatically.
3. The Results
After applying the manifests, the data started flowing.
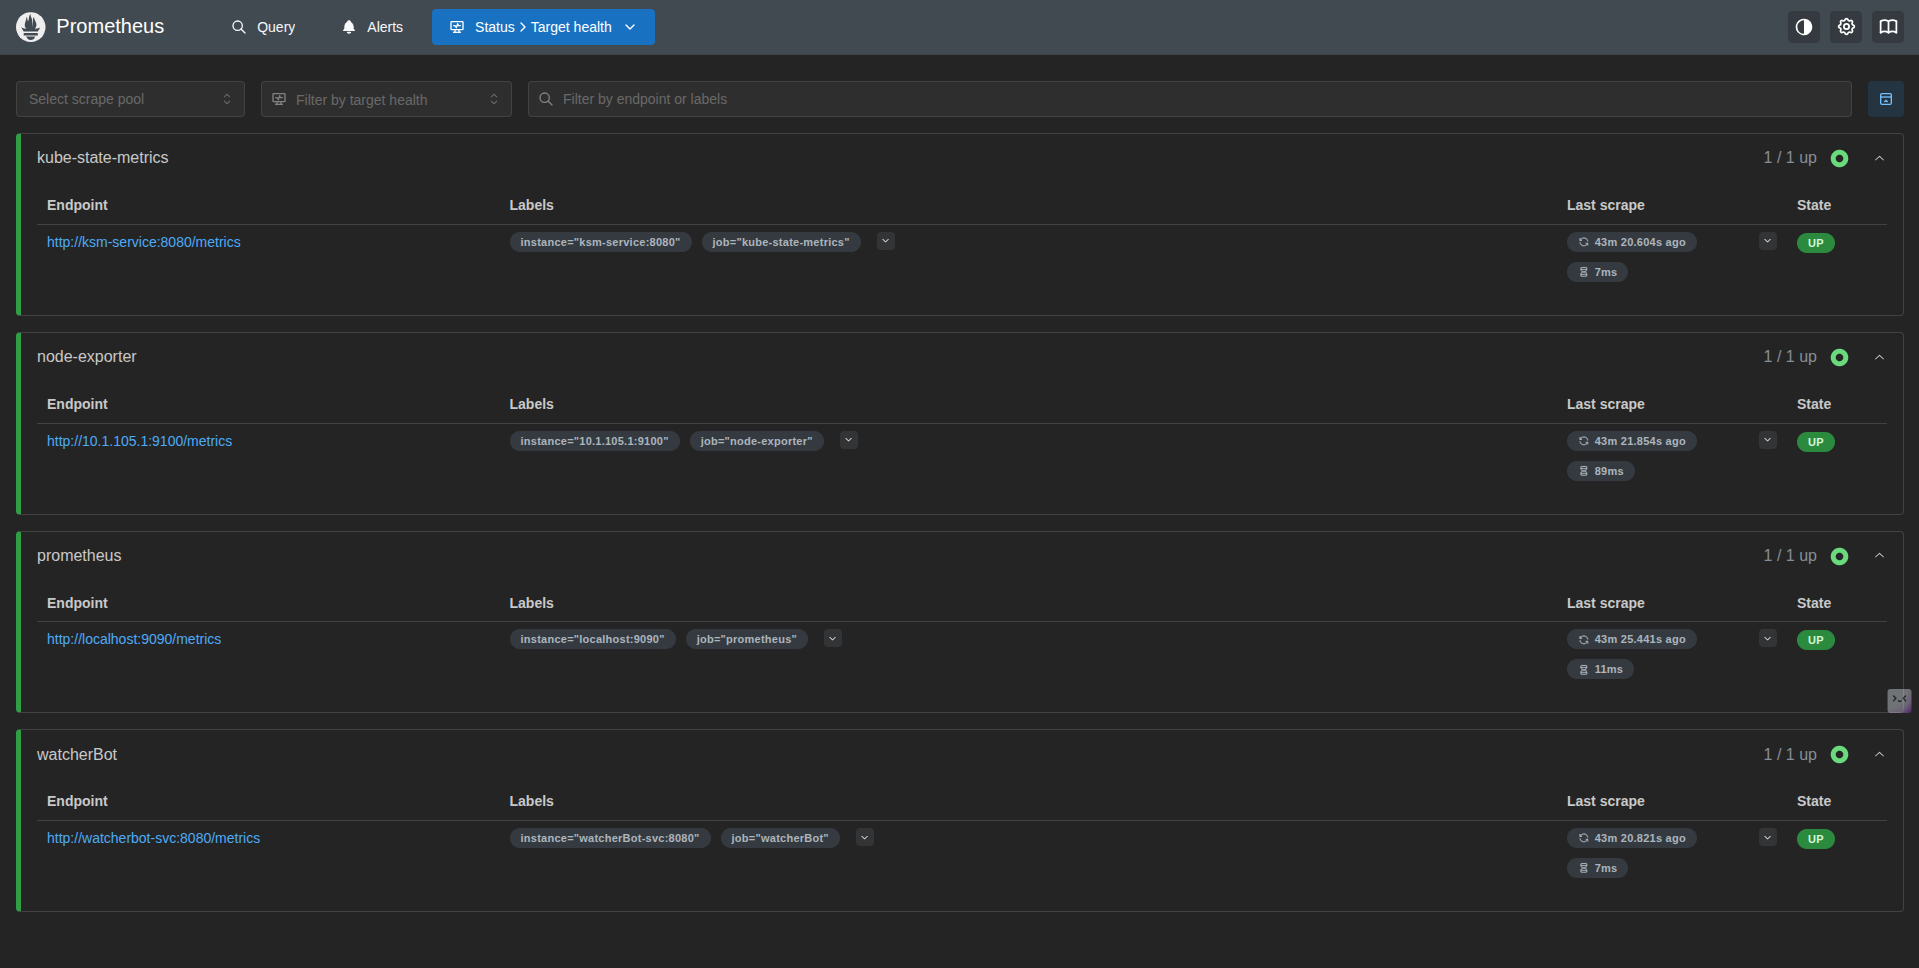
Prometheus Targets: Here you can see Prometheus successfully discovering the Node Exporter endpoints and the internal Kubernetes state metrics via the Service discovery I configured.
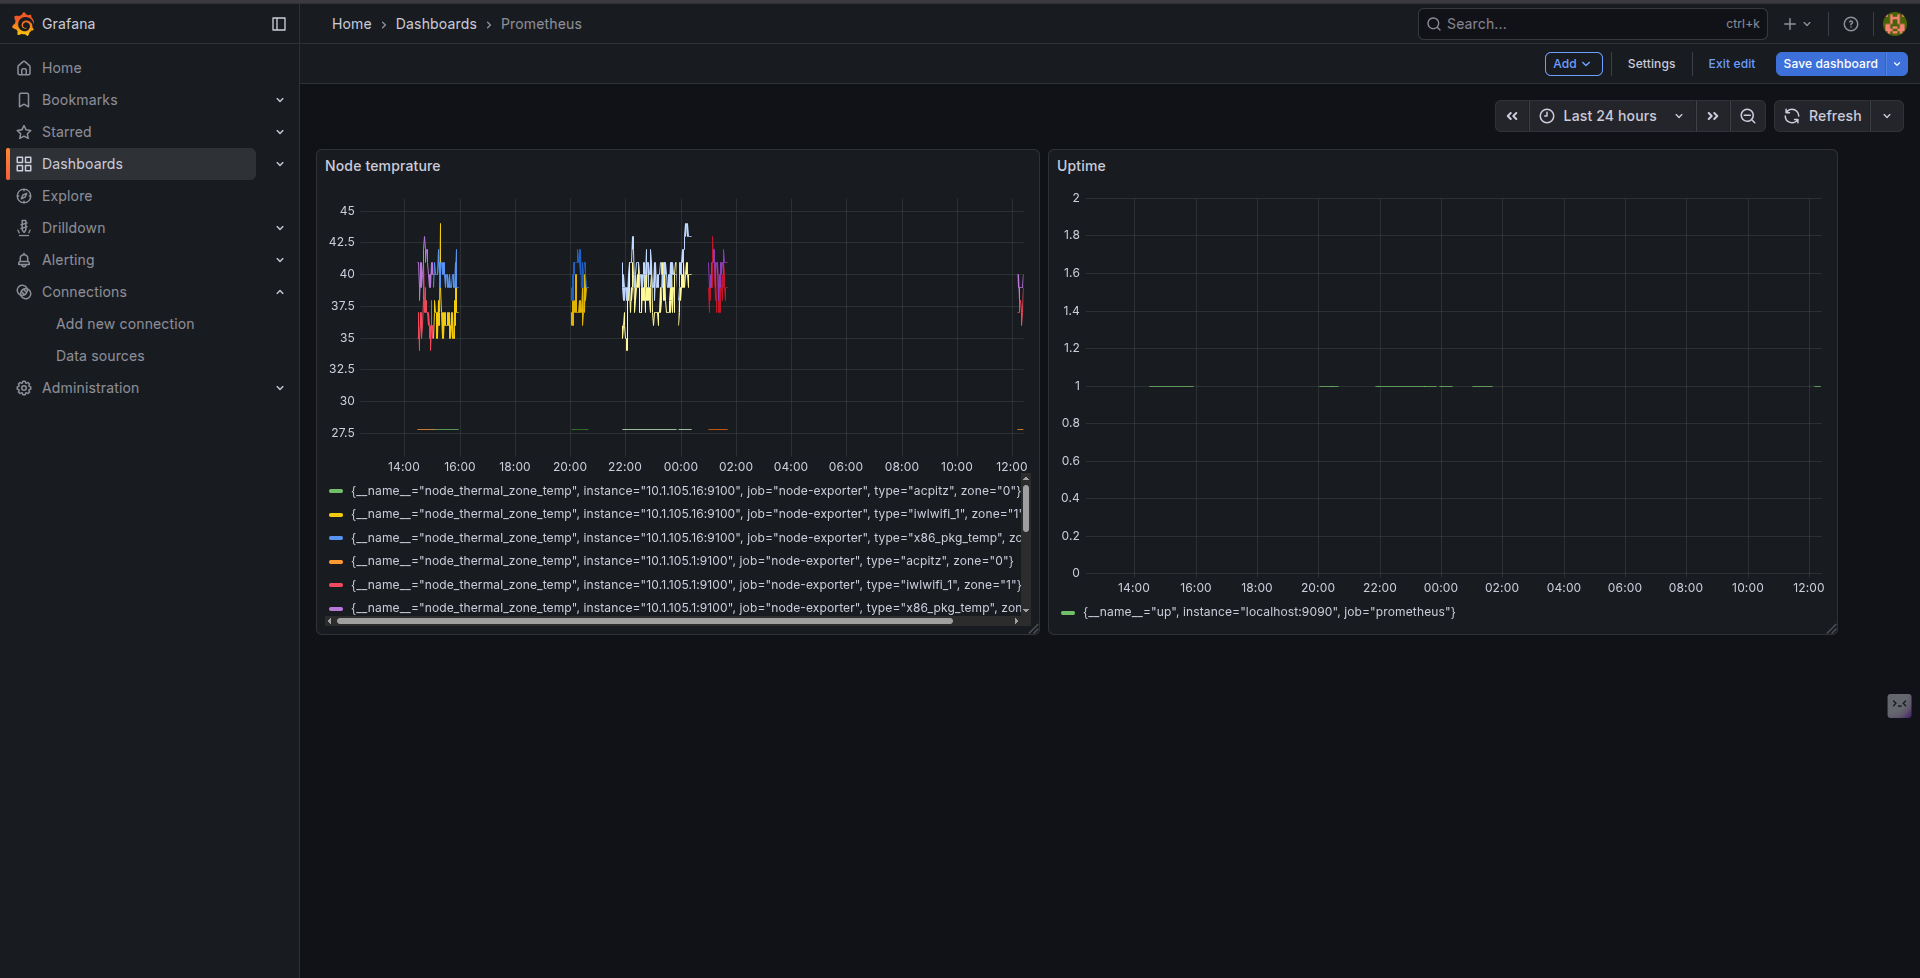
Grafana Visualization: I deployed Grafana and connected it to the Prometheus datasource. Below is the dashboard visualizing the Node temperature and uptime, proving the scrape config is working correctly.
You can find the code here
What's Next?
This phase gave me the "dopamine hit" of seeing real-time metrics and forced me to confront RBAC and Volume nuances head-on.
The next is about maturity. I will tear down this manual setup and rebuild the entire infrastructure (Cluster + Monitoring Stack) using Terraform, treating my infrastructure as code, Build a custom exporter for SLIs required commonly for businesses and finally write the autoscaling controller that would scale our infra based on the customized metrics we have defined
Stay tuned.