Kubernetes Resource Monitor & Cost Estimator
This project is a Go-based application designed to monitor Kubernetes resource requests, store historical data, and provide basic cost estimations based on those requests. It serves as a foundational tool for understanding resource allocation in a Kubernetes cluster.
Architecture:
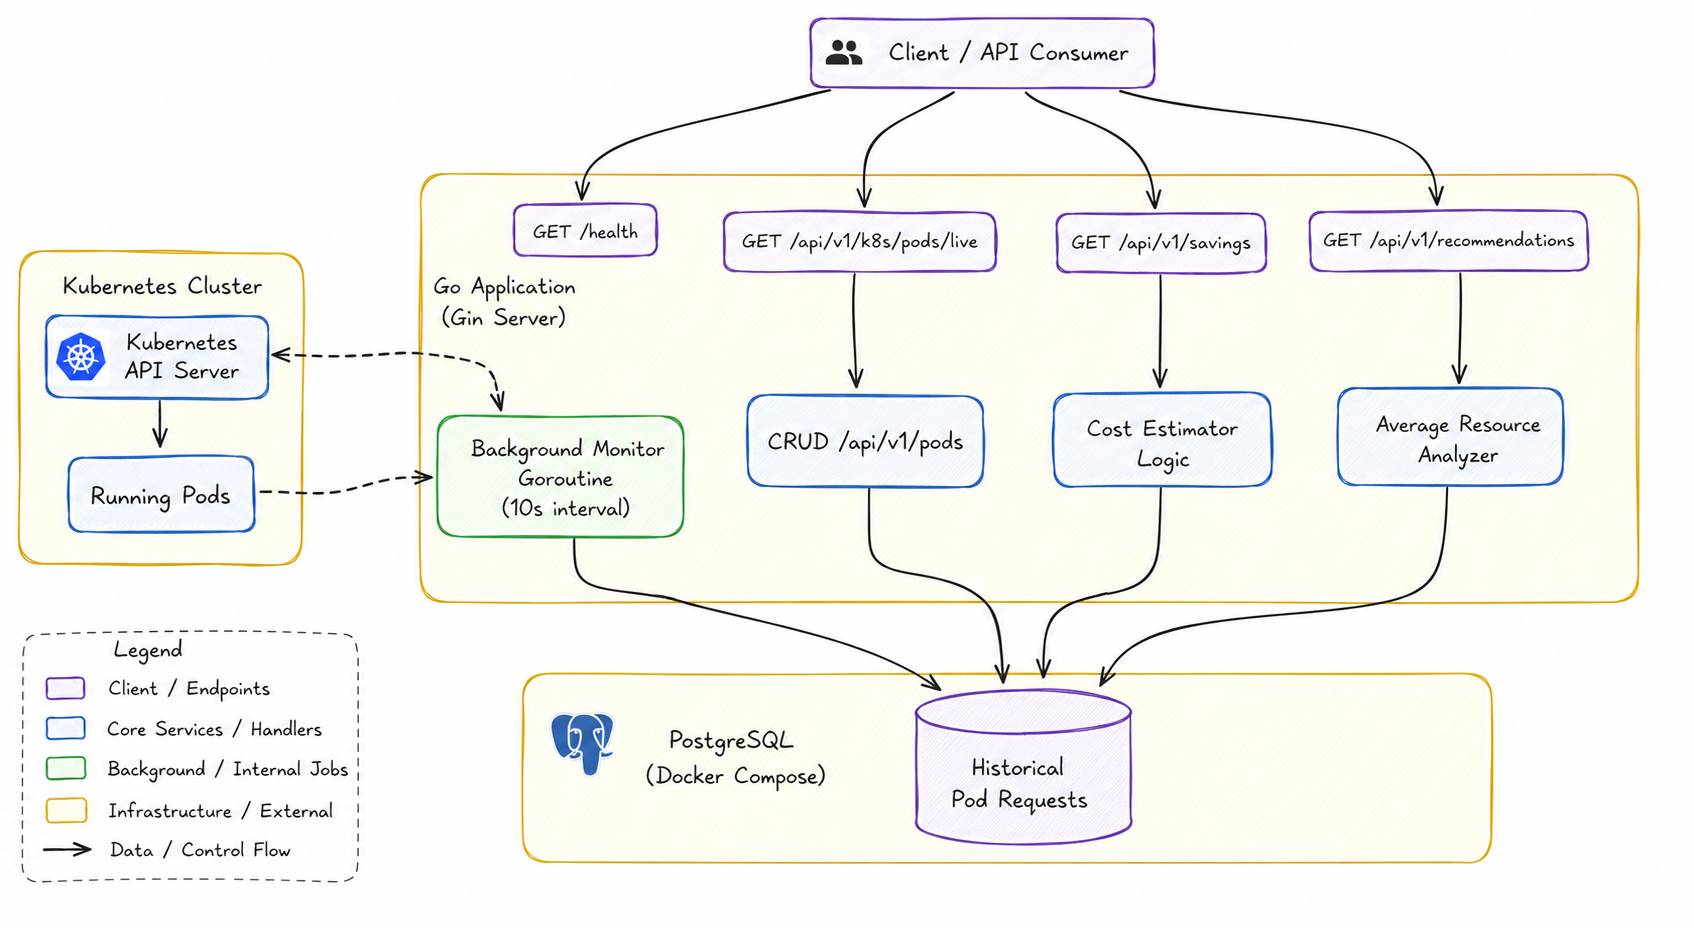
The system is built around a Go application running a Gin HTTP server. A background goroutine fires every 10 seconds, hits the Kubernetes API directly via client-go, pulls the current pod resource requests from the cluster, and writes them to PostgreSQL - no manual triggering needed, it just runs. On top of that, four REST endpoints expose different views into the collected data:
GET /health - basic liveness check GET /api/v1/k8s/pods/live - bypasses the DB entirely and fetches pod state straight from the Kubernetes API in real time GET /api/v1/savings - aggregates historical requests stored in Postgres and runs cost estimation logic against them GET /api/v1/recommendations - averages out CPU and memory requests per pod across all historical records so you can see which pods are consistently over-requested
Everything persists to PostgreSQL running via Docker Compose. The goroutine and the API handlers all write/read from the same historical_pod_requests table, so the cost and recommendation endpoints are always working off accumulated data, not just a point-in-time snapshot. The Kubernetes cluster (Minikube locally) sits separately - the Go app talks to its API server over client-go, reads the running pods, and that's it. No sidecar, no operator, just a straightforward out-of-cluster client hitting the K8s API.
Features
- REST API: Built with the Gin framework, providing endpoints to interact with the system.
- Database Persistence: Uses GORM and PostgreSQL (managed via Docker Compose) to store historical pod resource request data.
- Live Kubernetes Integration: Connects to a Kubernetes cluster (tested with Minikube) using the official
client-golibrary to fetch real-time pod information. - Automated Background Monitoring: A goroutine runs periodically (every 10 seconds by default) to fetch current pod resource requests from Kubernetes and save them to the PostgreSQL database.
- Cost Estimation: Provides an API endpoint to calculate the estimated hourly cost based on the sum of requested resources stored historically.
- Average Request Analysis: Includes an endpoint to calculate the average requested CPU and Memory for each unique pod based on historical data.
- Structured Code: Organized into packages for handlers, routes, database, Kubernetes client, and models for better maintainability.
Tech Stack
- Language: Go (Golang)
- API Framework: Gin
- Database: PostgreSQL
- ORM: GORM
- Containerization: Docker, Docker Compose
- Orchestration: Kubernetes (Minikube for local development)
- Kubernetes Client:
client-go
Setup and Running Locally
Prerequisites:
- Go (version 1.21+) installed
- Docker and Docker Compose installed
- Minikube installed and running
kubectlinstalled and configured to point to Minikube
Steps:
- Clone the repository:
git clone https://github.com/shivamchaubey027/k8s-cost-optimizer
cd k8s-cost-optimizer
- Start the Database:
docker-compose up -d
- Ensure Minikube is Running:
minikube status
# If not running, start it:
# minikube start
- Apply Sample Pods (Optional but Recommended): Apply the provided sample YAML files (or your own) to have data to monitor.
kubectl apply -f sample-pods.yml
# Verify pods are running
# kubectl get pods
- Install Go Dependencies:
go mod tidy
- Run the Application:
go run cmd/k8s-cost-optimizer/main.go
# Or navigate to cmd/k8s-cost-optimizer and run:
# go run .
The server will start onlocalhost:8080, connect to the database and Kubernetes, and the background monitor will begin collecting data.
API Endpoints
GET /health: Simple health check endpoint. Returns{"status":"ok"}.GET /api/v1/pods: Retrieves all pod records manually added via the POST endpoint (from Chapter 2).POST /api/v1/pods: Manually adds a new pod record to the database. Expects JSON body matching themodels.Podstruct.PUT /api/v1/pods/:id: Updates a specific pod record in the database.DELETE /api/v1/pods/:id: Deletes a specific pod record from the database.GET /api/v1/k8s/pods/live: Fetches and returns the current list of pods directly from the connected Kubernetes cluster's API (default namespace).GET /api/v1/savings: Calculates and returns the total number of historical records processed, the sum of requested CPU/Memory across those records, and the total estimated hourly cost based on those requests.GET /api/v1/recommendations: Calculates and returns the average requested CPU (cores) and Memory (GB) for each unique pod based on all historical data collected by the monitor.
Future Enhancements
- Integrate Actual Usage Metrics: Enable
metrics-serverin Kubernetes and update the monitor to fetch and store actual CPU/Memory usage alongside requests. - Refine Recommendations: Update the
/recommendationsendpoint to compare average requests vs. average usage and provide concrete suggestions for resizing. - Implement Upsert Logic: Change the monitor's database operation from
Createto an "Upsert" (Update or Insert) to prevent excessive row duplication and keep the database size manageable. - Configuration Management: Move constants (like pricing) and connection details into configuration files or environment variables instead of hardcoding.